


| Signal | Reading | Regime |
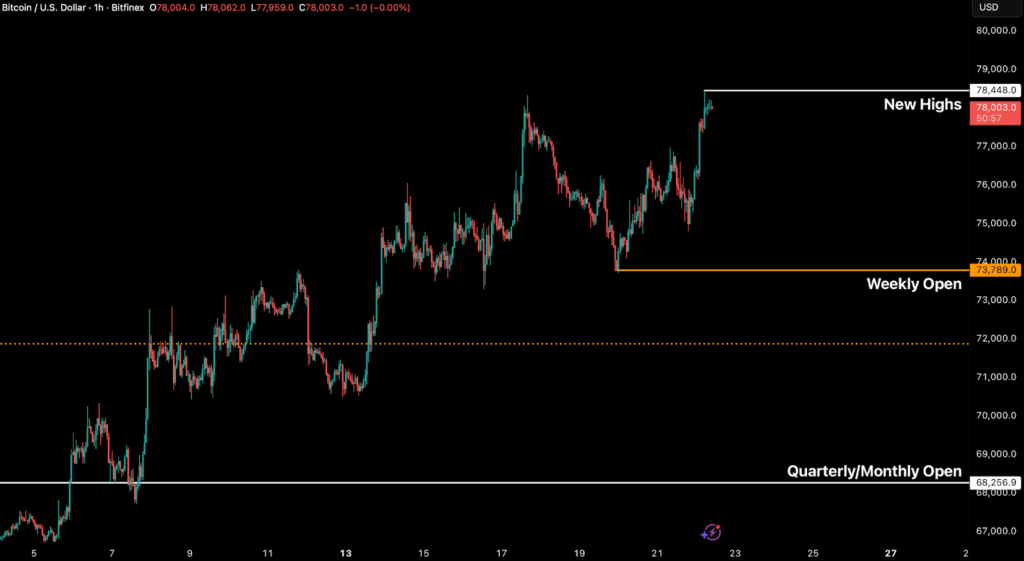
| BTC Spot | Above $74,500 resistance | Transition To LTF Uptrend |
| Funding Rate (aggregate) | ~8–12% APR | Neutral |
| Exchange Reserves | 2.21m BTC (7-yr low) | Structurally bullish |
| Whale Accumulation (30d) | +270,000 BTC | Highest since 2013 |
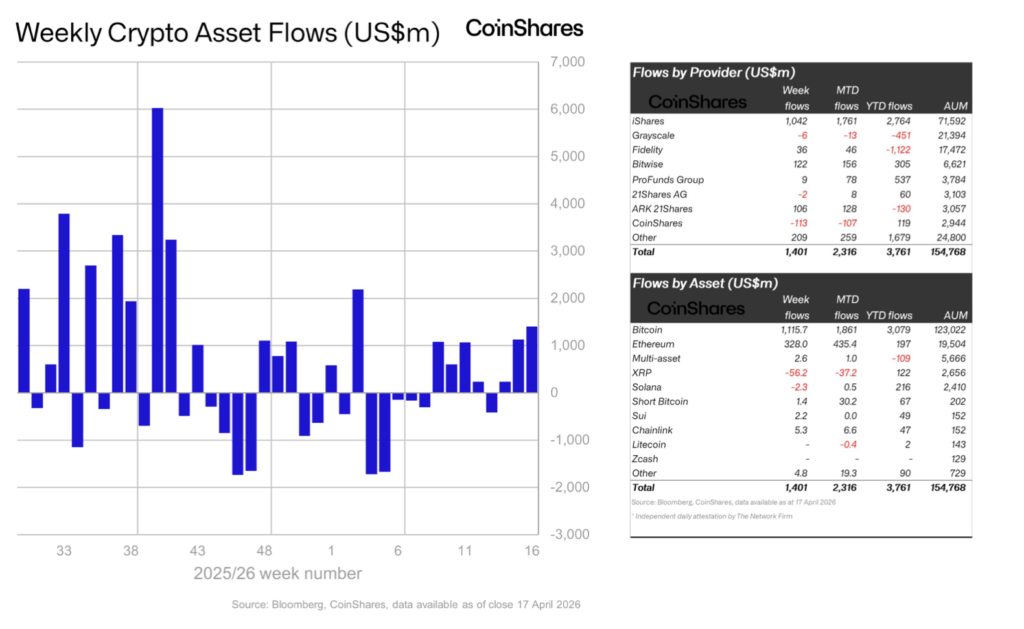
| ETF Flows YTD | +$2.3bn (flipped positive) | Bullish regime shift |
| Stablecoin Supply | $320bn (+$2.54bn 7d) | Liquidity expansion |
| ICD (CME vs Deribit hedge spread) | +0.38 (up from +0.22) | Institutional caution |
| DeFi TVL (48h change) | -$14bn (KelpDAO exploit) | Risk-off pressure |
| 24 Apr Options Max Pain | $72,000–$73,500 | Put-heavy, downside skew |
Bitcoin has moved above $78,000 and the momentum for price is decidedly towards upside since breaking past earlier range highs near $72k. This move is the product of two simultaneous geopolitical and on-chain shocks landing within 72 hours of each other.
Our thesis remains cautiously positive, driven by three specific catalyst resolutions against the constructive case: the Hormuz re-closure on 19 April, the KelpDAO exploit on 20 April, and April’s DeFi exploit loss tally crossing $606 million.
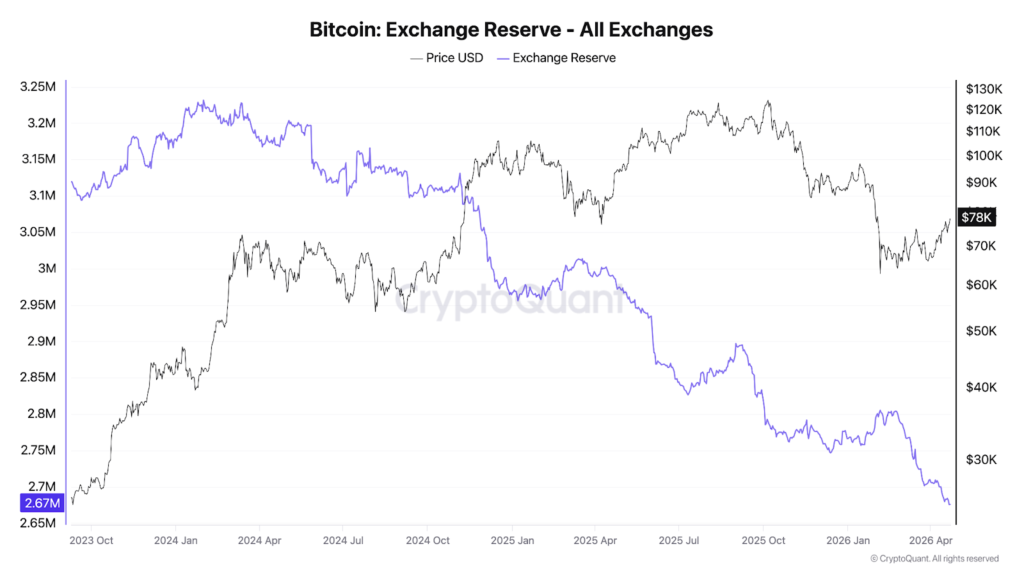
The structural backdrop has not changed. Exchange reserves sit at 2.41 million BTC, a seven-year low representing 5.88 percent of circulating supply. Whale wallets holding more than 1,000 BTC added 270,000 BTC in the last 30 days, the largest monthly accumulation since 2013. These aren’t the readings of a market about to precipitously fall; they are the readings of a market absorbing supply with intent. Near-term skew is bearish on geopolitical and derivatives mechanics; the medium-term structural thesis remains intact.
Bitcoin crossed the halfway point of its current halving cycle this week, with the network reaching 50 percent of the roughly 210,000 blocks between the April 2024 halving and the next one, expected in 2028. The milestone marks the point at which new supply issuance begins its final descent towards the next reward reduction from 3.125 to 1.5625 BTC per block, the last epoch where bitcoin block rewards contain more than 1 BTC.
The dominant macro narrative at the moment suggests that the growth of Artificial Intelligence is lowering the neutral rate of interest and therefore pulling forward rate cuts, which in turn is lowering the value of the dollar. The data doesn’t support this framing. The correct read in our view, is that the current trend toward dollar debasement is due to a structurally locked Fed. The Fed is structurally locked because PCE has remained sticky and as a result, inflation has not returned to target on a sustained basis. The payroll data beating consensus massively (as discussed below) adds to the argument of how a soft landing is not in play. The currently strong employment data deteriorates the argument that the Fed needs to make in order to justify cutting rates at this point in time. At the same time, they also cannot hike without risking destabilisation of a credit environment that’s already fragile.
The March Bureau of Labor Statistics (BLS) release showed nonfarm payrolls at +178,000 versus 60,000 consensus, the strongest reading since December 2024. The Polymarket no-cut probability sits at 39.6 percent, and the 10-year yield is anchored near 4.31 percent.
In addition, liquidity that benefits digital assets is increasing. Stablecoin supply hit $320 billion on 16 April, with $2.54 billion of seven-day inflows ($1.37 billion from USDt and $431 million from USDC). Stablecoin expansion is the cryptocurrency equivalent of M2 growth, and it has expanded every single week of Q2. Aggregate cryptocurrency Exchange-Traded Fund (ETF) flows have now flipped positive year-to-date to +$2.3 billion, with IBIT alone absorbing $871 million last week, nearing $64 billion in cumulative net assets.
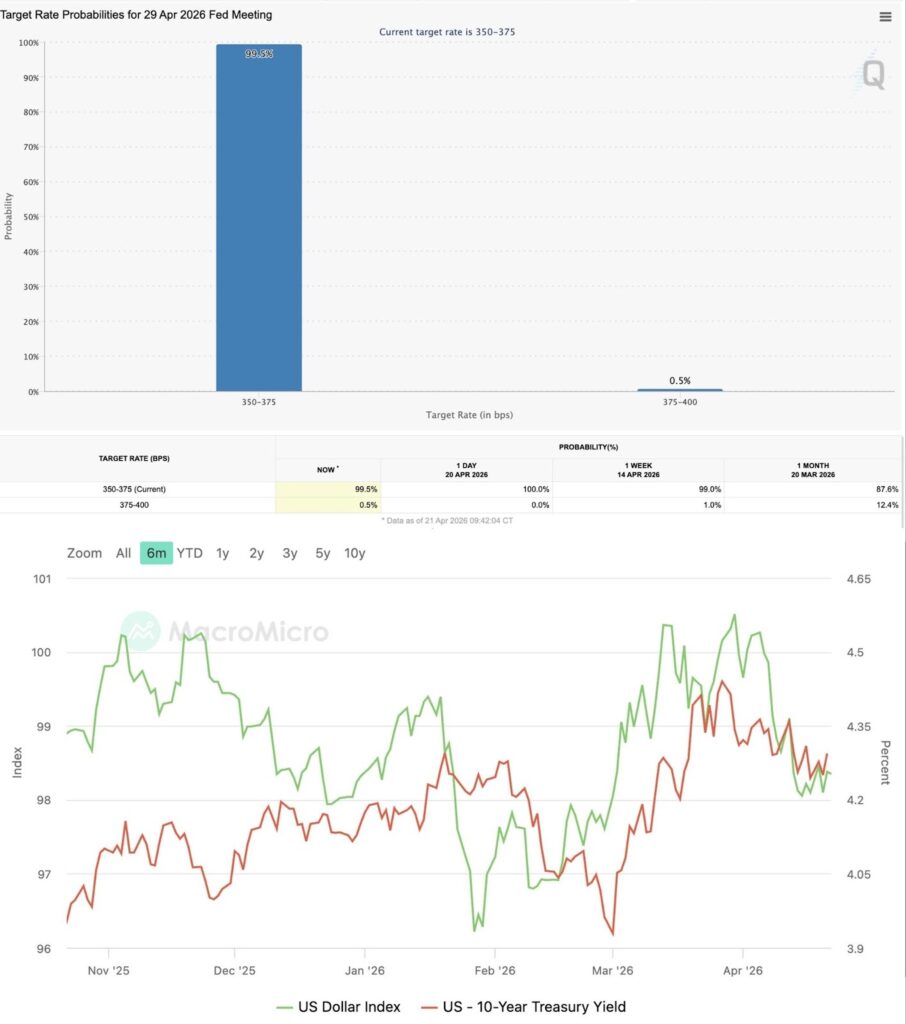
As for interest rate expectations and arguments for and against a cut, Fed Vice Chair Philip Jefferson has argued that the AI data-centre capex cycle is pushing the neutral rate higher, not lower, demonstrating how the disinflation-shock thesis from AI isn’t Fed consensus and the Fed board is openly split. The next live input into Fed direction will be from the 28-29 April Federal Open Market Committee (FOMC) meeting: with no Summary of Economic Projections (SEP), no dot plot, and only Fed Chair Jerome Powell’s press conference, his remarks carry the full weight of market-moving potential.
In our view, the positioning architecture confirms the liquidity thesis, not a rate-cut thesis. If this were purely a rates trade, altcoins would be leading. Instead, TOTAL2 has decoupled, altcoin dominance has failed to reclaim highs, and the DeFi complex is absorbing a distinct shock. Stablecoin expansion plus record whale accumulation plus IBIT inflow concentration equals a structural dollar-recycling trade, not a monetary pivot trade.
Iran again closed the Strait of Hormuz on 18 April following the US refusal to end its port blockade. Two Indian tankers were fired upon and the USS Spruance intercepted the Iranian-flagged Touska on 19 April in the first direct blockade clash. Even though the formal ceasefire has been extended indefinitely, the strait remains operationally dysfunctional since the weekend. Resolution in either direction is the single highest-impact catalyst on the tape.
Bitcoin’s behaviour during the escalation has been analytically significant. Total digital asset ETP assets under management (AUM) have risen 9.4 percent to $140 billion since the crisis began, during a period when traditional safe-haven assets saw notable selling pressure. BTC is demonstrating a partial hedge function for multi-asset allocators, a behaviour previously seen in March 2022 and August 2024. The key tell for the remainder of this week is spot cumulative volume delta (CVD) on the Asia and US cash opens around today’s ceasefire deadline.
Bitcoin has shown a notable divergence from its historical reaction to geopolitical shocks, and has essentially rallied during the recent Iran-driven instability. This contrasts with its typical function as a release valve for forced de-risking when traditional markets are closed.
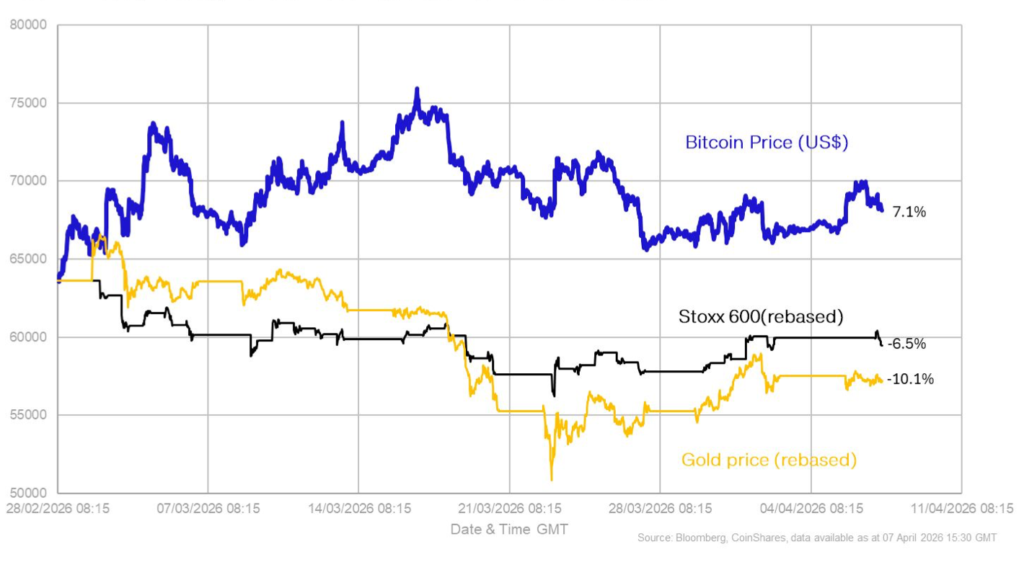
Bitcoin has also significantly outperformed other asset classes, posting a gain of 7.1 percent since the crisis began, compared with losses of 6.5 percent for equities and 10.1 percent for gold.
This resilience was underpinned by a significantly cleaner market structure heading into the crisis. An estimated $39 billion in whale distribution over the preceding five months had already pushed valuations and technical indicators into oversold territory. With leverage substantially reduced and much of the motivated selling pressure already exhausted, the market is in a stronger position to absorb new demand.
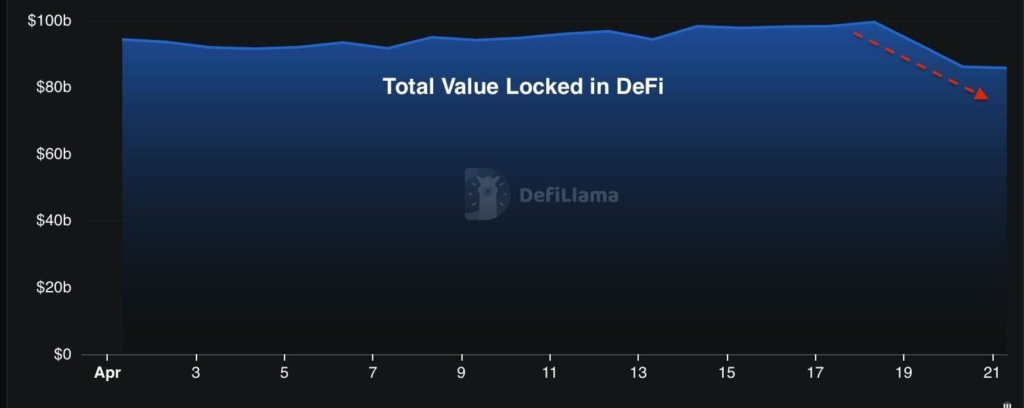
The KelpDAO exploit on 20 April was a $292 million breach, the largest single DeFi security event of the month. Combined with the Drift protocol loss of $285 million and smaller incidents, April’s total DeFi loss tally has crossed $606 million. Total value locked (TVL) dropped roughly $14 billion in 48 hours, the largest TVL contraction of 2026 and one of the largest 48-hour drawdowns on record.
The critical analytical question is whether this contagion remains within the liquid restaking token (LRT) and liquid staking token (LST) complex, or whether it propagates into centralised exchange stablecoin flows and bitcoin spot demand. The evidence so far suggests containment within the DeFi layer. The stETH/ETH basis hasn’t blown out. USDt mint cadence has continued its expansion trajectory. Bitcoin hasn’t seen the kind of spot CVD deterioration that would indicate exits from DeFi into fiat.
This isn’t a cleared risk, though. The threshold that would trigger a reassessment is a sustained stETH/ETH de-peg beyond 1 percent, or evidence that USDt redemption velocity is accelerating (net USDt destruction rather than minting). Neither has occurred. We have added DeFi security stress as an active signal set, and with trigger thresholds of greater than $100 million for a single event or greater than $500 million on a 30-day rolling basis; both have now been crossed in April alone.
The altcoin read is consistent with this framing. TOTAL2 failed to break out in line with the broader ceasefire narrative last week. The KelpDAO/LayerZero contagion is acting as a glass ceiling on the total altcoin market cap, not as a systemic collapse trigger. The interpretation is selective capital rotation, not broad-based risk-off.
A White House Council of Economic Advisers (CEA) report published this week directly contradicts the banking industry’s opposition to stablecoin yield. The GENIUS Act prohibits stablecoin issuers from offering yield to holders, citing projected reductions in bank lending. The CEA model estimates that eliminating stablecoin yield would increase bank lending by only $2.1 billion, at a net welfare cost of $800 million, with 76 percent of that marginal lending concentrated in large banks.
The policy significance is direct: the White House has handed opponents of the GENIUS Act’s yield prohibition a cost-benefit argument with official modelling behind it. The worst-case scenario, per the CEA’s analysis, is a negligible 0.02 percent increase in bank lending at the cost of eliminating consumer yield on dollar-denominated digital assets. This shifts the political calculus on the yield amendment still pending in Senate markup; it’s now harder to defend on economic grounds. For the stablecoin supply thesis, any relaxation of the yield prohibition is a structural demand amplifier; issuers would compete directly on yield, expanding the incentive for dollar-denominated holdings globally.