



If you trade BTC/USD, bitcoin CFDs, bitcoin futures, or bitcoin ETFs, here’s a deeper dive into what moved bitcoin this week and what to watch going into next week.
Bitcoin opened the week on shaky footing and never quite found its balance.
Buyers tried to steady the market, but each attempt to build momentum faded before it could turn into anything more convincing.
How the Week Unfolded
Here’s what happened this week.
Monday
The week opened with a $648.6 million single-day outflow from spot Bitcoin ETFs. The third-largest single-day redemption of 2026.
BlackRock’s IBIT absorbed the largest hit at $448.3 million. Ark’s ARKB followed with $109.6 million. Fidelity’s FBTC lost $63.4 million. Combined, those three funds shed $621 million.
Bitcoin slid to $76,769. Liquidations topped $180 million on the day as leveraged longs were flushed out.
Tuesday
ETF outflows continued. Another $331 million left the funds.
Bitcoin traded in a tight $76,082 to $77,587 band as traders positioned ahead of two major events later in the week.
Total net assets across the 11 U.S.-listed spot Bitcoin ETFs fell to approximately $100.5 billion.
Wednesday
Two big events landed within hours of each other.
First, the Federal Reserve released the minutes from the April 28-29 FOMC meeting. Jerome Powell’s final meeting as Fed Chair. They ran more hawkish than the statement had implied.
Multiple committee members raised concerns about inflation persistence. One governor voted for a cut. Three opposed easing language entirely.
Then Nvidia reported first-quarter earnings after the close.
Bitcoin rallied from $77,657 at the NYSE close to a session high of $78,013 on the Nvidia print. Then it hit $78,000 and got rejected. By midnight, it had faded back to $77,545.
Also, on Wednesday, SpaceX filed its IPO prospectus with the SEC for a Nasdaq listing. Buried in the filing was the first detailed public disclosure of the company’s bitcoin position.
Thursday
Representatives Nick Begich (R-AK) and Jared Golden (D-ME) introduced the American Reserve Modernization Act of 2026 (ARMA).
Bipartisan legislation that would codify a Strategic Bitcoin Reserve within the U.S. Department of the Treasury with an attached 20-year holding mandate.
The stated goal is 1 million BTC. The bill directs the Treasury to study budget-neutral ways to get there rather than mandating purchases outright.
Friday
Bitcoin held the $76,700 to $77,500 range into the close.
ETF outflows extended the streak to six consecutive sessions. Friday’s damage was just $105 million.
Macro and Flows
Here is what drove the selling this week.
Rates
The April 28-29 FOMC minutes, released Wednesday, confirmed the committee remains divided and leans hawkish.
With inflation still running above target, the probability of any cut before year-end has largely evaporated.
The 10-year Treasury yield climbed to 4.63% during the week, a 12-month high, before pulling back slightly to approximately 4.60% into the Friday close.
Bitcoin pays no interest and no dividends. When Treasuries yield 4.6%, the case for holding bitcoin gets harder to make to institutional allocators.
Spot ETF Flows
Spot Bitcoin ETFs recorded outflows across six consecutive sessions from May 15 through May 22, a streak that began the previous Friday and ran through the entire week.
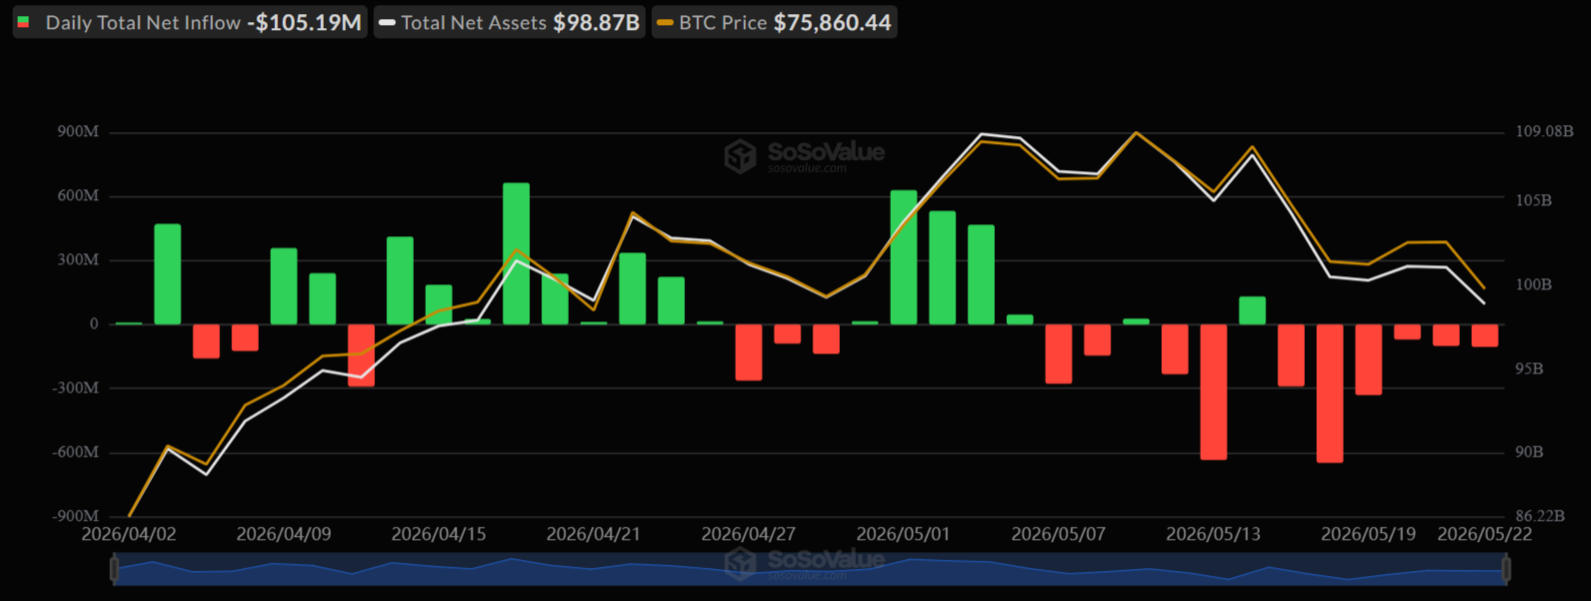
Total AUM across the 11 funds dropped to roughly $100.5 billion.
Cumulative net inflows since launch stand at approximately $57.7 billion (the literal cash value institutional and retail investors have funneled into these products, minus any cash redemptions).
The $648.6 million Monday outflow represents less than 1% of that inflow base.
Santiment, a blockchain analytics firm that tracks crowd sentiment and on-chain behavior, noted this week that ETF outflow periods have historically marked bottoms more than tops.
They pointed to the July and October 2025 outflow windows as examples where heavy redemptions preceded recoveries.
The SpaceX Disclosure: The Bitcoin Nobody Could See
This is the story that flew under the radar this week.
When SpaceX filed its S-1 IPO registration statement with the SEC on Wednesday, it disclosed holding 18,712 BTC as of March 31, 2026.
Acquired at a total cost basis of approximately $661 million, implying an average purchase price of roughly $35,320 per coin.
That number was more than double what on-chain analytics firms had attributed to SpaceX. Arkham Intelligence and Bitcoin Treasuries had estimated the company held approximately 8,285 BTC based on tracked wallet addresses.
The gap exists because SpaceX uses third-party custodians. Holdings sitting in regulated custody don’t appear on-chain.
The filing also disclosed that SpaceX originally acquired 25,724 BTC in 2021 and has reduced the position to 18,712 over time.
The timing and rationale for the 6,912 BTC reduction are not detailed in the filing.
Where does that leave the institutional picture? SpaceX now ranks as the seventh-largest corporate Bitcoin holder globally.
Behind Strategy’s 843,738 BTC. Ahead of Tesla’s 11,509 BTC. Valued at current prices, the 18,712 BTC position sits at approximately $1.45 billion.
On-chain trackers thought they knew how much bitcoin SpaceX held. They were off by more than double.
If that’s true for SpaceX, it’s probably true for others. The real corporate ownership picture is likely larger than the public data suggests.
This doesn’t move the price today. But it changes what we think we know about who’s holding.
Technical Backdrop
Bitcoin’s Friday close came in around $77,000.
Saturday’s session added one more twist. Price dropped to $74,197, extending the week’s losses.
Then Trump posted on Truth Social that a deal with Iran is “largely negotiated” and the Strait of Hormuz will reopen.
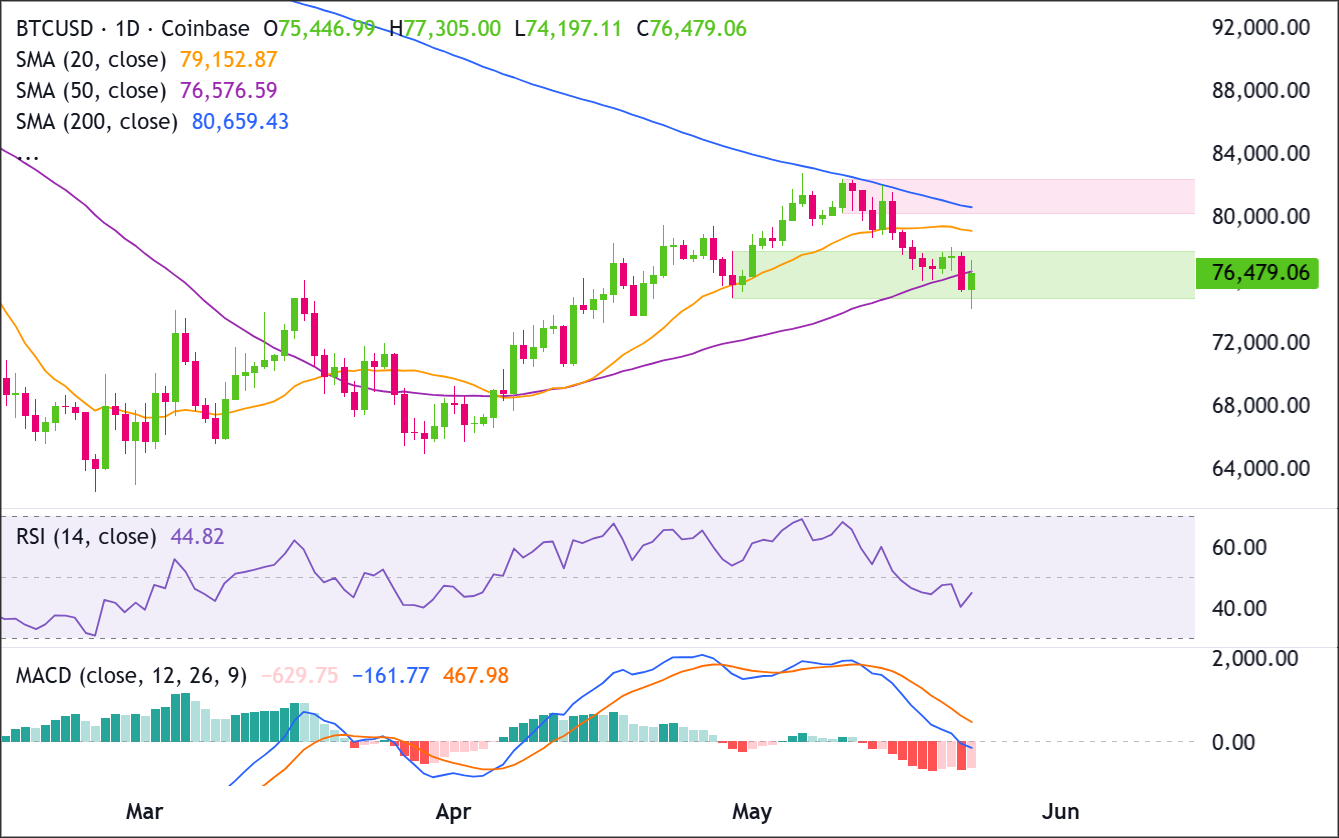
Bitcoin reversed sharply, reclaiming $77,000 before settling at $76,479, right at the broken 50-DMA.
Recent Price Action
The last seven days show a drift lower inside the green demand zone, with price unable to reclaim the 20-DMA at $79,153.
No momentum in either direction. Just a slow grind down with sellers in control.
Today’s session pushed to a low of $74,197 before recovering to close at $76,479, just below the 50-DMA. That low is the deepest print in this leg down so far. Whether it holds is the question going into next week.
Moving Averages
Price has broken below the 50-DMA and is now trading beneath all three moving averages.
The 50-DMA at $76,576.59 has been breached. Bitcoin closed at $76,479. Just $97 below it. That’s not a meaningful breakdown by distance, but a close below it is a close below it. It now acts as resistance on any bounce.
The 20-DMA at $79,152.87 is the next ceiling. It’s $2,673 above current price and has not been reclaimed all week.
The 200-DMA at $80,659.43 is the bigger wall. Crucially, the 200-DMA is visibly declining on the chart. The blue line is sloping downward. Resistance is drifting lower toward price.
Momentum
The RSI is at 44 and declining. It is not oversold yet. But the direction is down, and it has room to fall further before reaching the 30 level where prior bounces have occurred.
The MACD tells the same story. Both lines are below zero. The histogram bars on the right side of the chart are red and shrinking. There’s no divergence, no curl upward. Just bearish momentum grinding lower.
Key Support & Resistance Levels
Here are the levels that matter right now and why.
| Level Type | Price Zone | Technical Significance |
|---|---|---|
| Major Resistance | $80,000–$82,000 | Pink resistance band on chart; declining 200-DMA at $80,659 sits within this zone |
| Immediate Resistance | $79,153 | 20-DMA; has not been reclaimed this week |
| Near Resistance | $76,577 | 50-DMA; broken to the downside, now acting as resistance |
| Immediate Support | $72,000–$74,000 | Next meaningful support zone below current price |
| Cycle Floor | $58,000–$63,000 | 200-week MA (~$58K); Realized Price (~$62K) |
Current Market Conditions at a Glance
Here is everything in one place.
| Indicator | Current Reading | Signal | Context |
|---|---|---|---|
| BTC/USD Close | $76,479.06 | Bearish | Session range $74,197–$77,305; 6th consecutive ETF outflow day |
| All-Time High | $126,198 (Oct 2025) | — | ~39% below ATH |
| BTC Dominance | ~58% | Neutral | Altcoin rotation not broadly underway |
| 200-DMA | $80,659.43 | Bearish | Declining; ceiling bitcoin has failed to close above all month |
| 20-DMA | $79,152.87 | Bearish | $2,673 above current price; unreclaimed all week |
| 50-DMA | $76,576.59 | Bearish | Broken to the downside; now acting as resistance |
| RSI (14-day) | 44.82 | Bearish | Declining; not oversold yet but heading lower |
| MACD | Both lines below zero | Bearish | Histogram red and shrinking; no divergence or curl upward |
| 10-Year Treasury Yield | ~4.60–4.63% | Bearish | 12-month high; raises opportunity cost for BTC |
| FOMC Minutes (Apr 28–29) | More hawkish than statement | Bearish | Majority of participants open to further hikes if inflation persists |
| Nvidia Q1 Earnings | $81.6B revenue (beat $78.8B) | Neutral | Brief BTC bounce to $78,013 rejected; faded to $77,545 |
| Monday ETF Flows | -$648.6M (IBIT -$448.3M) | Bearish | Third-largest single-day outflow of 2026 |
| Week ETF Outflows | ~-$1.08B (3 confirmed sessions) | Bearish | Monday -$648.6M, Tuesday -$331M, Friday -$105M; full-week total pending confirmation |
| Total ETF AUM | ~$100.5B | Neutral | Structural base intact despite weekly pressure |
| Cumulative ETF Inflows | ~$57.7B | Bullish | Long-term demand base undamaged |
| SpaceX BTC Disclosure | 18,712 BTC ($1.45B at current prices) | Bullish (long-term) | Cost basis $35,320; undisclosed until IPO S-1 filing |
| ARMA Bill | Introduced May 21 (bipartisan) | Bullish (long-term) | Early stage; 20-year hold mandate; no purchase requirement yet |
The Big Things to Watch Next Week
The week ahead is shorter. U.S. markets are closed on Monday for Memorial Day. That leaves four sessions to establish direction.
The Iran deal
Trump announced Saturday that a deal with Iran is “largely negotiated” and the Strait of Hormuz will reopen. That’s not a signed agreement. It’s a Truth Social post.
If talks progress and a formal deal is reached, lower oil prices would ease inflation pressure, which would ease rate hike fears, which matters directly for bitcoin.
If talks stall or collapse, the macro headwind returns.
Watch for any formal announcement or breakdown early in the week.
The $72,000 to $74,000 support zone
The 50-DMA has already been broken and is now resistance. The next meaningful level is the $72,000 to $74,000 zone.
A daily close below $74,000 puts that zone directly in play with limited obvious support before $70,000.
A reclaim of the 50-DMA followed by recovery through $79,000 would be the first credible sign of a short-term bottom.
ETF flow momentum
Six consecutive sessions of outflows does not reverse overnight. The conditions required to turn flows constructive: the streak needs to break, not just slow.
Two back-to-back large positive-flow sessions would be the minimum signal worth acting on.
ARMA bill trajectory
The bill was introduced on Thursday with 18 co-sponsors, including one Democrat. It needs a committee assignment before it goes anywhere.
Watch whether it receives a hearing date in the coming weeks. A Senate companion bill would also change the timeline.
At this stage, ARMA is a long-term structural signal, not a near-term price catalyst.
Bottom Line
This was a week that started with brutal ETF outflows, briefly flirted with optimism on Nvidia’s numbers, and ended where it started. Stuck below the 20-DMA with no confirmed reversal.
The macro backdrop has not changed. The 10-year yield is at a 12-month high. The FOMC minutes were more hawkish than anyone wanted. Rate cut expectations have largely collapsed.
What did change this week: SpaceX’s IPO filing revealed 18,712 BTC in corporate treasury that on-chain data had completely missed. ARMA was introduced with bipartisan support.
Long-term holders are buying and sitting tight. ETF investors are selling every time a bad inflation number drops. One group is thinking in years. The other is thinking in days.
What to Watch When Positioning
Treat any rally into the $80,000 to $82,000 zone as a test of resistance.
That changes only when bitcoin closes above the 200-DMA at $80,659 with conviction and ETF flows turn positive for two or more consecutive sessions.
The 50-DMA at ~$76,577 has already been broken. It is now resistance.
The next meaningful level is the $72,000 to $74,000 zone.
A daily close below $74,000 puts that zone directly in play. A reclaim of the 50-DMA followed by recovery through $79,000 would be the first sign the low is in.
For longer-term accumulators, bitcoin is already in the range where prior cycles have seen durable buying.
But the trend is still down, and there is no confirmed reversal.
Waiting for ETF flows to turn meaningfully positive, not just technically green, for two consecutive sessions gives a cleaner setup before committing size.
